
In my continuing quest to know All The Things about the ecology faculty job market, I compiled some data on recent EEB faculty job applicants. How many positions does the typical applicant apply for these days? How many publications do they have? How many interviews and offers do they get? And is there anything besides the number of applications they submit that predicts the number of interviews or offers they’ll receive? For the answers, read on!
Attention conservation notice: long-ish post ahead, but stick with it, the most important and surprising results are at the end. And I think it’s of broad interest to many of you, not just to current EEB faculty job seekers. And there are lots of graphs. 🙂
Methods
You can probably skip this section if you’re familiar with ecoevojobs.net, and/or don’t care that much about the nitty-gritty details of the data.
To compile the data, I went to ecoevojobs.net. If you didn’t know, ecoevojobs.net is an annual crowdsourced EEB faculty job ad compilation. I downloaded the data from all ecoevojobs.net “anonymous qualifications” pages. These are the Google Docs spreadsheets on which anonymous EEB faculty job seekers can provide various bits of information about themselves: their area of expertise, when they got their PhD, their current job title, their gender, how many peer-reviewed papers they’ve first-authored and co-authored, how many EEB faculty jobs they applied for that year, what types of institutions they applied to, how many interviews and offers they got, and more. The purpose is to give EEB faculty job seekers some context. But there’s so much variation in the data that it’s hard to just eyeball the spreadsheets and get much useful context. Hence this post, which summarizes the data graphically.
Before we go further, a few words on data quality. Sometimes when I present analyses of ecoevojobs.net data, I get comments to the effect that these data are obviously so bad–such a biased sample and so full of errors–as to be totally useless for any purpose. If that’s how you feel, you’re of course entitled to your opinion, and we’ll have to agree to disagree (in which case you should probably stop reading now, because the rest of this post is just going to annoy you…). My own view is that, in the absence of any other non-anecdotal source of information about EEB faculty job applicants, it makes sense to look at ecoevojobs.net data cautiously. “Cautiously” means three things:
- Draw only tentative conclusions. (Which is very different than “dismiss out of hand any conclusion that conflicts with one’s priors”.) That’s why I’m not going to bother doing formal stats on these data. I don’t want to give a false sense of how precise or rigorous my conclusions are.
- Be alert to possible sampling and measurement biases, and treat them as testable hypotheses wherever possible. Check for hypothesized biases by comparing the data to other sources of information.
- Remember that sampling and measurement biases are different than sampling and measurement errors. The former are non-random, the latter are random. In particular, we expect random sampling error and random measurement error to obscure real associations between variables, not create or strengthen apparent associations between variables. And we do not expect sampling or measurement bias in one variable to bias its apparent association with some other variable, unless the strength or direction of that sampling or measurement bias is itself associated with the values of the other variable.
I will follow commandments 1-3 in what follows.
I compiled data for six completed “job years”: 2009-10, 2012-13, 2013-14, 2015-16, 2016-17, and 2017-18. I can’t find ecoevojobs.net spreadsheets for 2010-11 or 2011-12, or for any year before 2009-10. The anon quals page for 2014-15 appears to have had many entries deleted in a non-random way, presumably by accident (stuff gets accidentally deleted all the time on ecoevojobs.net). But in any case the remaining 2014-15 data seem like too small and biased a sample to be useful. And the 2018-19 job season isn’t complete yet, which biases some aspects of those data (some applicants are still getting interviews and offers). Sample size is 441 people in total, ranging from 16 in 2012-13 to 93 in 2009-10. Note that some of those people might actually be the same people reporting their data in multiple years.
Regarding data processing: in a very few cases applicants gave approximate numbers, such as “~10 applications” or “>20 first-authored papers”; I replaced those with the number (e.g., 10 or 20, respectively). Most applicants gave their research area as some area of ecology, with fewer from evolution, but I retained everyone, even those rare ones working in, say, physiology or systems biology. It would’ve been too much work to cull the non-EEB folks. Most applicants didn’t yet hold a tenured or tenure-track faculty position, but I retained the very few who did (after all, they’re part of the faculty job market too). It’s possible that in a few cases applicants reported cumulative data rather than annual data, for instance reporting how many applications they’ve ever submitted, rather than how many they submitted that year. But I had no way to identify those cases, plus I’m pretty sure they’re too rare to be worth worrying about.
There’s some missing data, some of which is missing non-randomly. For instance, many people in 2009-10 didn’t report gender, and those who didn’t report gender differ from those who did on some other dimensions. (UPDATE: And people who report submitting few applications are more likely not to report the number of interviews and offers they received. The updated analyses address this reporting bias, which wasn’t discussed in the original post.)
In early years, applicants were asked how many “short lists” they made, and to describe the “outcome” of their job search. I’m not sure what “short list” means here (and some of the applicants seem not to have been too sure either…). In some cases it seems to have meant “my reference letters were requested”, which isn’t that helpful because some searches request letters for all applicants. So although I did look at the short list data I’m not going to report it here (ask me in the comments if you really want to hear about it…). In later years applicants were instead asked to say how many phone/skype interviews they had, how many campus interviews they had, and how many offers they received. Some applicants in the early years gave the numbers of phone/skype interviews, campus interviews, and offers they received as their “outcome”, in which case I recorded that information. But if anyone just provided a number of interviews as an outcome, without specifying the type of interview, I didn’t record that. So in the analyses below, data on phone/skype interviews, campus interviews, and offers come mostly but not entirely from the last 3 years of the dataset. Note as well that in the early years “no interviews and no offers” was rarely reported as an outcome, to an extent that make me suspect reporting bias. So data from the early years may underestimate the frequency of applicants who got no interviews and no offers.
Results
EEB faculty job seekers as a group
EEB faculty job seekers are 47% women. That’s with a sample size of 401 people who gave their gender, so random sampling error should be small, even if some of those people are actually the same person reporting in multiple years. 47% women is very close to the 46% women among US ecology postdocs as of 2013 (Hampton & Labou 2017). So I don’t think we’re systematically under- or over-sampling women faculty job seekers here, at least not to any major extent.
EEB faculty job seekers mostly identify as white. For instance, 93% of the 92 applicants on the 2017-18 anon quals page list their race/ethnicity as “white”. It’s similar in other years. That broadly lines up with data from the NSF Survey of Earned Doctorates, which finds that the large majority of US PhD recipients in ecology and allied fields identify as white. Unfortunately, there are so few non-white EEB faculty job seekers listed on ecoevojobs.net that it’s not useful to compare them to the white job seekers (which in itself is sobering). So I didn’t split out job seekers by race/ethnicity in any further analyses.
EEB faculty job seekers typically are 2-6 years post-PhD, but <2 and >6 are not unheard of. I’ve actually shown that previously with a subset of these data, and the full dataset doesn’t change anything (results not shown). Those numbers seem plausible because they line up with the data for US ecology postdocs as of 2013, who were ~4-5 years post-PhD on average (Hampton & Labou 2017). Those numbers also line up with the data for recent TT ecology faculty hires, who are 3-4 years post-PhD on average, with most but not all being 2-6 years post-PhD. So I suspect ecoevojobs.net is sampling job seekers fairly randomly with respect to years of post-PhD experience.
The “typical” EEB faculty job seeker submits 10-15 faculty job applications per year, but there’s a lot of variation:
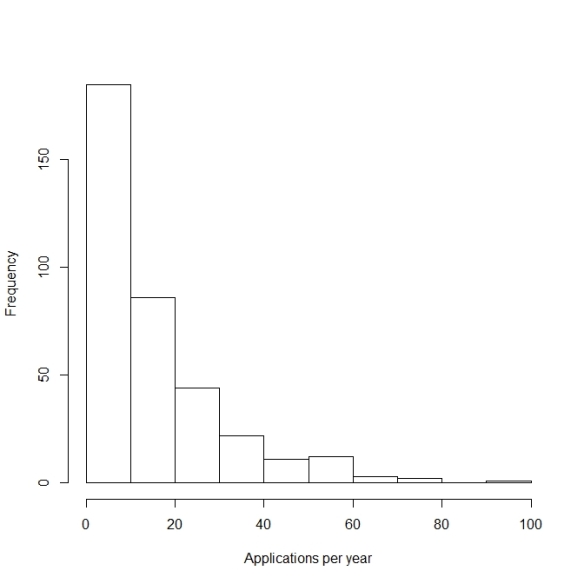
This wide variation is no surprise, given all the factors that affect which and how many positions someone will apply to. Note that these data might be biased slightly low if some faculty job seekers didn’t update their anon quals data with applications submitted later in the year. Conversely, they could be biased a touch high if a few people included applications for postdoc or non-academic positions in their anon quals data, and if a few people gave cumulative data rather than annual data. And it’s possible the various sampling and measurement biases could more or less cancel one another out in the aggregate; I’m not sure.
The typical EEB faculty job seeker has about 16 peer-reviewed papers, about 8 of which are first-authored, but there’s a lot of variation:
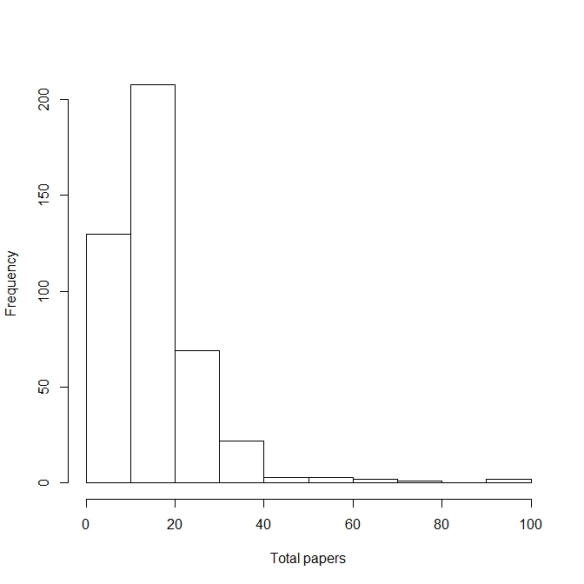
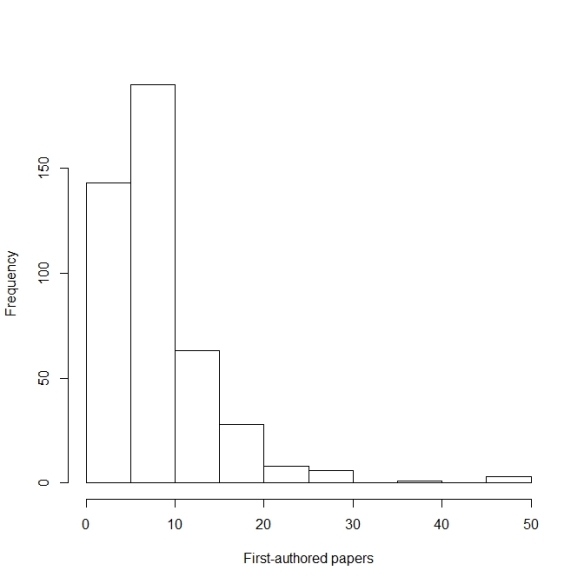
These numbers seem broadly plausible to me. The mean and median # of first-authored papers for EEB faculty job seekers are a bit lower than for recent TT ecology faculty hires at R1 universities, as you’d expect because not all faculty job seekers want the research-intensive jobs that tend to be filled by people with many publications. And there’s a lot of variation in publication count among recent TT ecology faculty hires, even just among recent TT hires at R1 unis. So you’d expect a lot variation in publication count among EEB faculty job seekers too. (Aside: so if you’re a faculty job seeker with a below-average publication count, compared either to other EEB faculty job seekers or to recent hires at R1 unis, do not leap to the conclusion that you are uncompetitive!)
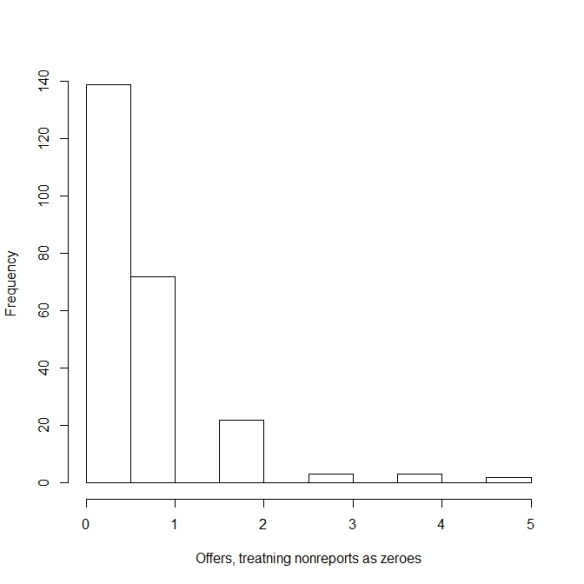
The “typical” EEB faculty job seekers gets 2-3 phone/skype interviews in a given year, and 1-2 campus interviews, but there’s a lot of variation:
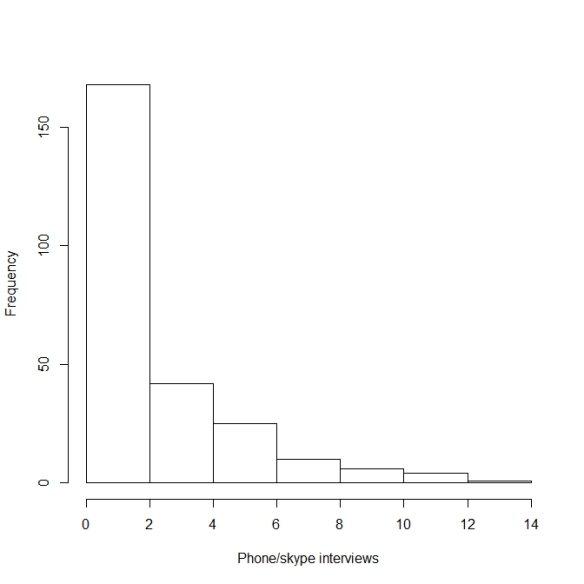
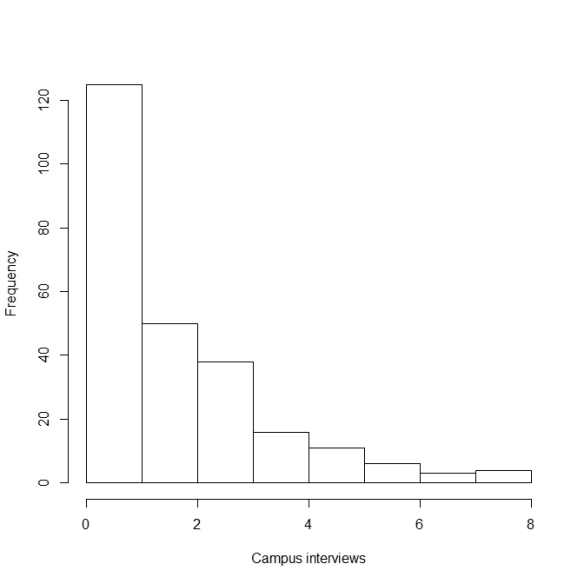
Those numbers seem broadly plausible to me, just based on my own anecdotal experience and knowledge of the anecdotal experiences of others. But hard to say for sure. They could be biased high if people who get no interviews or offers choose not to share this sad news on ecoevojobs.net.
UPDATE: The graphs and data above treat non-reports of interviews in years 2015-16 onward as zeroes, which I stupidly didn’t realize my R code was doing when I first wrote this post. But that’s ok, because that accidentally turns out to be a reasonable analytical decision to correct for likely reporting bias. It turns out that people who didn’t report the number of phone/skype or campus interviews they received tended to be people who applied to few positions:
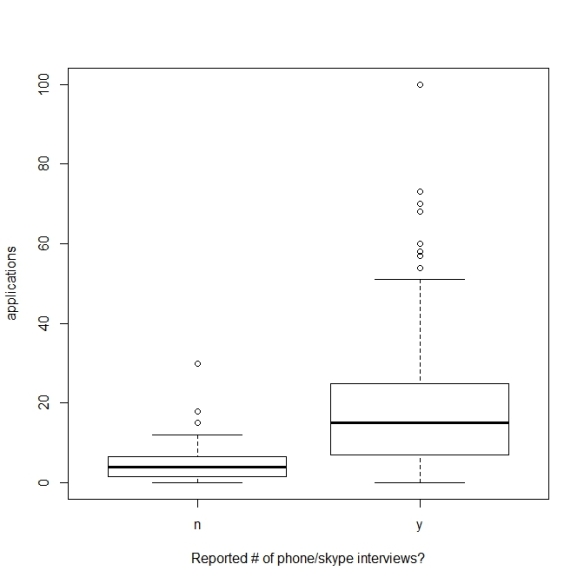
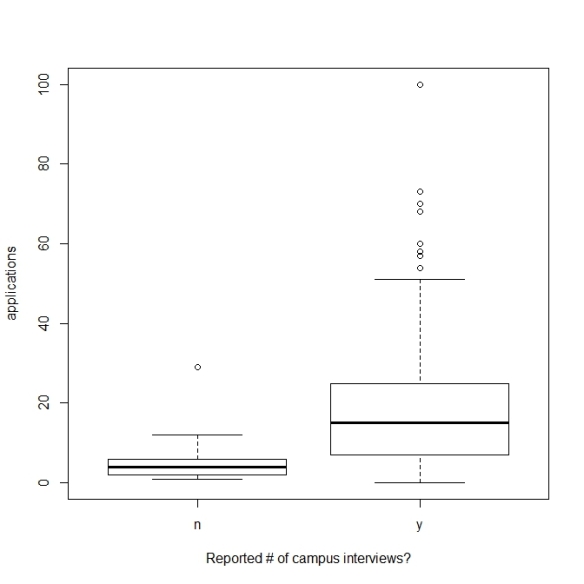
Applying to few positions means you’re unlikely to get any interviews (as shown later in the post). So assuming that nonreports of interviews are zeroes is a reasonable assumption. So I think the only way that reporting bias would seriously skew the data on # of phone/skype interviews and campus interviews per person per year is if people who don’t report anything on ecoevojobs.net differ in some big systematic way from those who report at least some information. Which they might–or might not. It’s hard to say. /END UPDATE
58% of EEB faculty job seekers reported receiving at least one faculty job offer in a given year, and 17% reported receiving multiple offers in a given year (UPDATE: And if you assume, reasonably, that people from 2015-16 on who didn’t report # of offers got no offers, those numbers drop to 42% and 12%):
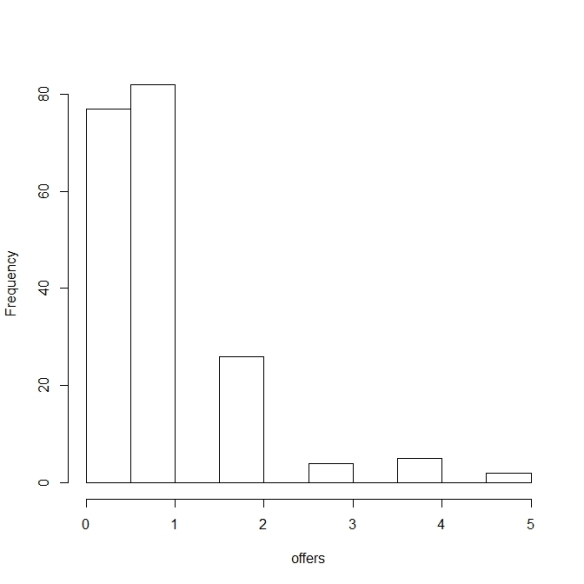
The fraction receiving an offer in a given year is higher than I would’ve guessed. (although out of sympathy for EEB faculty job seekers I wish it was 100%!) By which I don’t mean “huh, the job market’s in pretty good shape, why does everyone complain about it?” (I don’t think that!) I just mean “huh, I didn’t expect that.” And that’s even though I might’ve expected these data to be biased low by non-reporting of offers. Some people enter their anon quals data early in the job season and then don’t update at the end with the interviews and offers they received. On the other hand, maybe people who receive an offer are more likely to update their ecoevojobs.net info with this happy news than are people who don’t get an offer. My tentative conclusion is that somewhere around half-ish of EEB faculty seekers get at least one offer in a given year, or maybe a bit less. But it’s hard to say with much precision, due to possible reporting biases. /END UPDATE
So, job seekers: if you didn’t get an offer this year, don’t beat yourself up over it. You’re far from alone, it happens to plenty of good people every year, and it doesn’t mean you did anything wrong or that you’re not good at what you do.
Trends over time (or the lack thereof)
There’s no obvious trend over time in how many applications per year the typical EEB faculty job seeker submits:
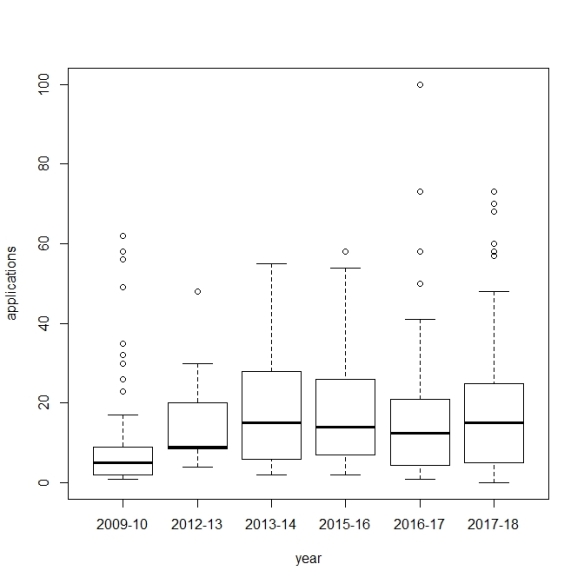
Well, except that number of applications per person did run lower in 2009-10. Not sure if that’s a blip, or a signal of the Great Recession. You can’t apply for jobs that don’t exist, and there may well have been relatively few jobs in 2009-10.
There’s no obvious trend over time in how many first-authored papers the typical EEB faculty job seeker has:

Neither of these non-trends surprises me, but I’m guessing they might surprise some of you. In particular, I got the sense from social media comments on this recent post that some people think that EEB faculty job seekers started publishing more in the wake of the Great Recession, as faculty jobs dried up and the competition for the remaining ones got tougher. There’s not much sign of that in these data, though I guess if you squint there might be a slight bump in first-authored papers from 2013-14 on. (no sign of a bump in 2012-13, though that year’s a small sample so we can’t learn much from it). The lack of any obvious trend in first-authored pubs per applicant broadly supports my hypothesis that ecology faculty job seekers have long been pretty much maxed out in terms of how much they publish, because the faculty job market has long been very competitive. Which isn’t to say that the EEB faculty job market didn’t get even more competitive in the wake of the Great Recession, just that any respects in which it got more competitive don’t include “EEB faculty job seekers all started publishing way more papers”.
What types of institutions do EEB faculty job seekers apply to?
Some ecoevojobs.net respondents provide information on what types of institutions they’re applying to. I looked at these data for the most recent three years, for which 242 job seekers provided info (125 women, 117 men). Here’s what I found:
Most EEB job seekers apply for faculty jobs at research universities, especially R1 universities. Fewer apply to other sorts of institutions. 55% of EEB faculty job seekers explicitly say they’re applying to R1 institutions. An additional 26% say or strongly imply that they’re applying for faculty positions at research universities (and possibly other sorts of institutions), for instance by saying that they’re applying “broadly”, to “anything TT”, to “any PhD-granting uni”, for “everything that fits”, etc. So that means that 81% are including research universities in their search. In contrast, only 24% explicitly say they’re applying to small liberal arts colleges (“SLACs”), and it’s still fewer than half even if you include everyone applying “broadly” or to “everything” or etc. I wouldn’t put too much stock in the precise numbers here. But broadly speaking, all this lines up with (limited) data indicating that R1 ecology faculty jobs tend to get more applicants than non-R1 jobs.
Slightly to my surprise, there was no gender variation in the types of institutions to which EEB faculty job seekers apply (results not shown, but trust me, there’s no hint of a difference). I expected women might be a bit more likely than men to apply to less research-intensive institutions, because the proportion of women among recent TT ecology faculty hires is slightly negatively correlated with the research intensiveness of the hiring institution (data here). If there is any variation in the types of institutions to which men vs. women EEB faculty job seekers apply, it doesn’t show up in the ecoevojobs.net data.
Predictors of how many interviews and offers an applicant receives
Contrary to popular (?) belief, the number of publications an EEB faculty job seeker has does not predict the number of interviews or offers they receive in a given year. Not even after controlling for the number of applications submitted that year.
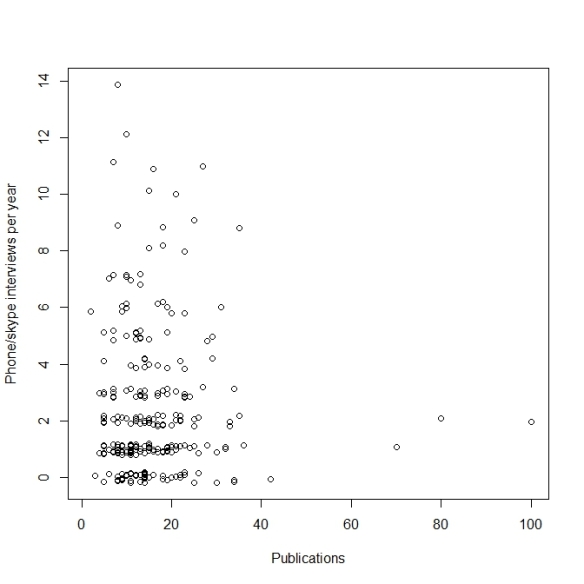
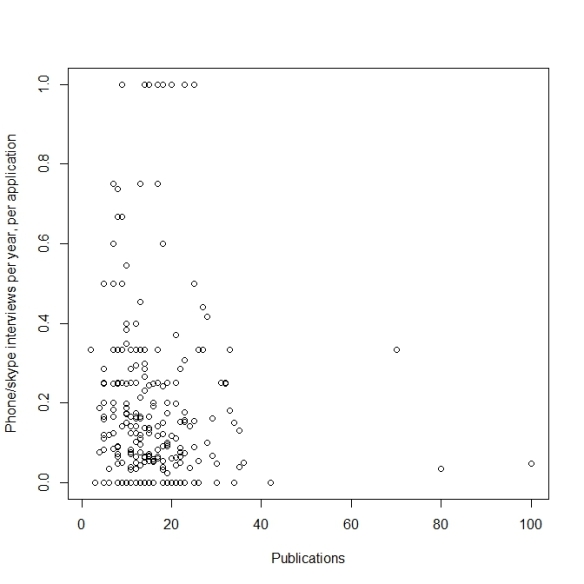
Those last two plots are for phone/skype interviews, but the equivalent plots for campus interviews and offers also look like shotgun blasts (not shown). And they still look like shotgun blasts if you swap in first-authored papers for total publications. Whether you like it or not (and I know there are people who feel both ways…), crude quantitative metrics like publication counts have no predictive power for how many interviews or offers you’ll get (same for h-index, # of classes taught, # of grants obtained, etc.). That’s for two reasons. First, basically everyone on the EEB faculty job market has some publications, some first-authored publications, some sort of teaching experience, etc. Second, crude quantitative metrics like counts of publications, or grants, or classes taught, or etc., are, well, crude. They don’t capture the things that any search committee looks for (plus, different search committees look for different things). Bottom line: publication counts and other crude quantitative metrics don’t predict success among EEB faculty job seekers for the same reasons that height doesn’t predict success among professional basketball players.
There are two variables that have some predictive power for the number of phone/skype interviews, campus interviews, and offers an applicant will receive in a given year: number of applications submitted that year, and gender.
DISEMBODIED VOICE: We interrupt your regularly scheduled blog post for a somewhat grouchy rant:
I’m deliberately not telling you the direction of the gender effect just yet, to try to force you to read on. Gender diversity and equity are vitally important issues, on which many people have very strong views. Which unfortunately sometimes makes productive online conversation…difficult. In the interests of a productive conversation, here and on social media, PLEASE READ THIS ENTIRE SECTION CAREFULLY BEFORE DRAWING ANY CONCLUSIONS ABOUT WHAT THESE DATA MEAN, OR ABOUT MY OWN VIEWS ON GENDER AND EQUITY. AND PLEASE DON’T TWEET ABOUT THESE RESULTS UNTIL YOU’VE READ THIS WHOLE SECTION CAREFULLY. Nobody wants to have words put into their mouth, and nobody wants misinformation circulating on social media. So although I know you’re super-busy and probably impatient to learn the “take home message” of this section, please slow down and read carefully rather than skimming. And be prepared for the possibility that the “take home message” might be different than you thought it would be, and might be too complicated to convey in one tweet. I’m sorry to bang on about this, honestly I am. The vast majority of comments to my past posts on gender and equity have been productive (for which thank you!). But enough have not been that I feel like I need to do what I can to prevent them. I spent several hours researching and writing this post, trying my best to interpret the data carefully and choose my words thoughtfully. I can’t promise I was perfect, and if I messed up or if you disagree with me, by all means say so and explain why. If I need to correct the post, I will. But please do me and others the favor of reading, commenting, and tweeting thoughtfully rather than shooting from the hip or going off half-cocked.
DISEMBODIED VOICE: We now return you to your regularly scheduled blog post. Jeremy certainly does go on, doesn’t he? 🙂
Below are data on # of phone/skype interviews as a function of # of applications and gender. Each symbol is data from one person in one year. Red circles are women, black squares are men, points are jittered vertically for visibility:
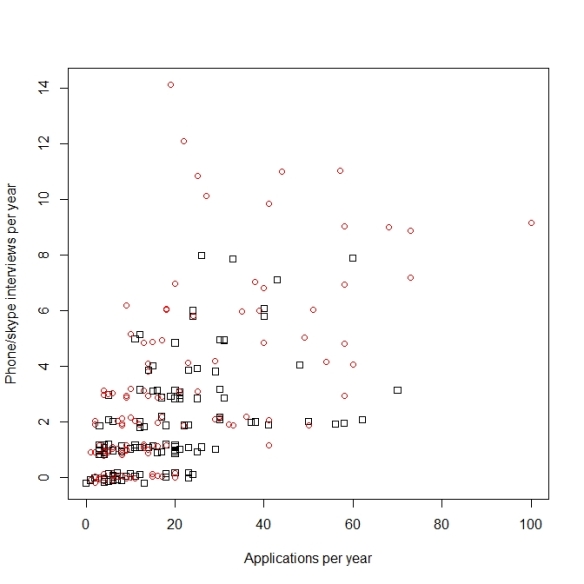
Not surprisingly, the more faculty job applications you submit in a year, the more phone/skype interviews you tend to get, though the relationship is noisy. The relationship also appears nonlinear. Expected number of phone/skype interviews appears to asymptote beyond about, oh, 30ish applications or so. Which makes sense. Presumably, applicants who submit many applications in a given year can only do that by submitting many long-shot applications for jobs for which they’re poor fits. Conversely, people who submit few applications in a given year are in some (not all) cases focusing those applications on positions for which they’re probably good fits.
Women report receiving more phone/skype interviews than men. That effect of gender is less visually obvious than the effect of # of applications, but it’s definitely there. Women reported receiving a mean of 3.0 phone/skype interviews in a given year, vs. 2.0 for men (medians are 2 and 1, respectively). Among applicants who reported 5 or more phone/skype interviews in a given year, women outnumbered men 30 to 14. And every one of the 11 applicants who reported >8 phone/skype interviews in a single year was a woman. (UPDATE: These results probably slightly understate the gender effect, because it turns out the relatively few people from 2015-16 on who didn’t report the # of phone/skype interviews they got are 60% men. People who submitted few applications probably got few or no phone/skype interviews. There aren’t that many people who didn’t report the number of phone/skype interviews they got, and the gender balance of those people isn’t massively skewed towards men. So even if none of those non-reporters got interviews it wouldn’t make the gender effect that much bigger. /END UPDATE)
The results for campus interviews are the same as for phone/skype interviews, though the relationship with number of applications is noisier. That’s as you’d expect, since campus interviews are rarer than phone/skype interviews:
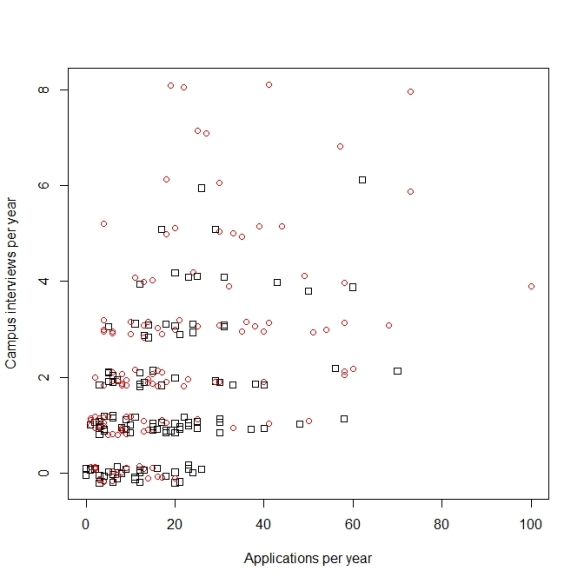
Women reported receiving an average of 2.4 campus interviews/year (median 2), while men reported an average of 1.5 (median 1). 85% of women reported receiving at least one campus interview in a given year, vs. 75% of men. Among applicants who reported receiving at least 4 campus interviews in a given year, women outnumbered men 26 to 12. (UPDATE: These results may very slightly understate the gender effect, because it turns out the relatively few people from 2015-16 on who didn’t report the # of campus interviews they got are 53% men. People who submitted few applications probably got few or no campus interviews. There aren’t that many people who didn’t report the number of campus interviews they got, and the gender balance of those people is only very slightly different from that of the full dataset. So even if none of those non-reporters got interviews it would only very slightly increase the strength of the gender effect on # of campus interviews. /END UPDATE)
It’s interesting (and reassuring) that the plot for # of campus interviews seems to level off around 30ish applications/year, just like the plot for # of phone/skype interviews.
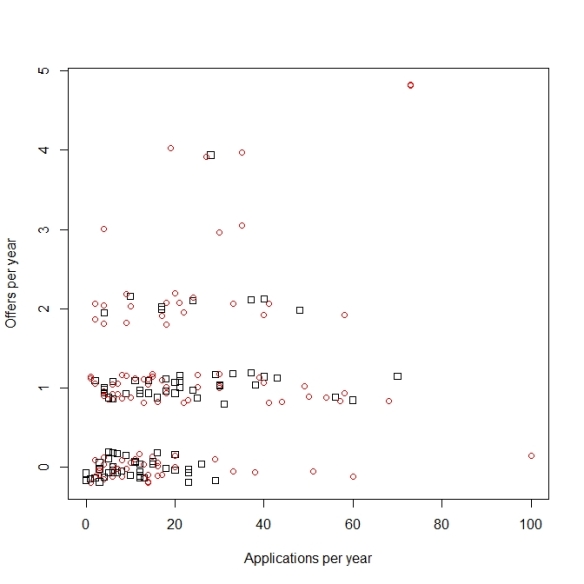
Below are the data on # of offers received in a given year. As you’d expect, the relationships with # of applications is noisier still, since offers are rarer than campus interviews. The relationship with gender is still there: women reported an average of 1.0 offers per year, vs. 0.7 for men. 63% of women reported receiving at least one offer in a given year, vs. 49% of men. And 24% of women reported receiving multiple offers in a given year, vs. 6% of men.
UPDATE: These results may well understate the gender effect on # of offers received, because it turns out the people from 2015-16 on who didn’t report the # of offers they got are 68% men. The majority (though not all) of the people from 2015-16 on who didn’t report how many offers they got are also people who submitted few applications, and who didn’t report how many phone/skype or campus interviews they got either. As discussed above, it’s probably safe to assume that most of those nonreporters got no interviews, meaning they didn’t get any offers either. If few or none of the non-reporters got offers–which seems more plausible than that many got offers but just didn’t get around to reporting this information–it would increase the strength of the gender effect on # of offers a bit. Here’s the same plot as the last one, but with all nonreports of offers from 2015-16 on treated as zeroes:
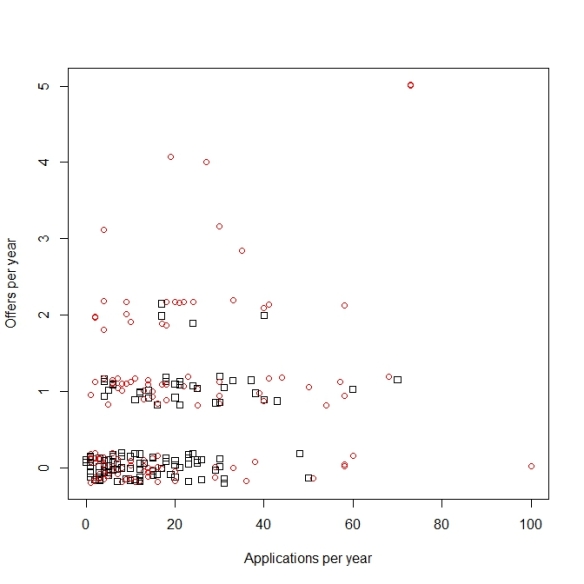
/END UPDATE)
For context (because it’s hard to eyeball this from the plots above), the distribution of # of applications submitted in a given year is exactly the same for men and women (it’s lower for the few applicants who didn’t provide their gender). So it’s not that women receive more interviews and offers on average because they apply for more positions on average. In the plot below, gender is blank for those applicants who didn’t provide their gender:

And male applicants reported publishing a couple more first-authored papers than women on average (and also more total papers; not shown):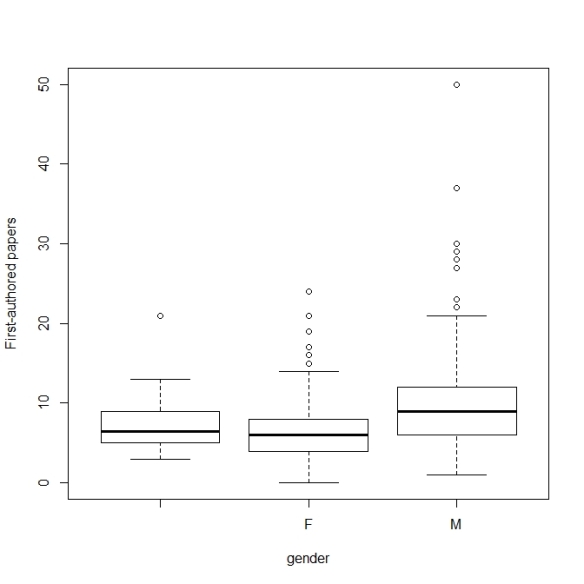
I buy these gender-related results; I don’t think they’re the product of random sampling and measurement errors, or sampling and measurement biases. But they’re just statistical associations between variables; it’s vitally important to interpret them carefully.
A big reason I believe that women really did get slightly more interviews and offers than men on average is because it lines up with what we know from my very comprehensive data on recent tenure-track ecology faculty hiring. Over the last 3 years, 57% of newly-hired N. American tenure-track asst. professors in ecology have been women, and the 95% confidence interval is 55-59%. Further, as with EEB faculty job applicants, newly-hired women TT asst. profs in ecology are identically-experienced to the newly-hired men, in terms of years post-PhD. And as with EEB faculty job applicants, newly-hired women asst. profs in ecology have published a bit less on average than newly-hired men asst. profs in ecology (Although, importantly, the gender difference in publication count among recently-hired ecology faculty goes away almost entirely once you control for the research intensiveness of the hiring institution. There are systemic forces that nudge women towards faculty positions at less research-intensive institutions. But women and men ecologists recently hired into the same type of institution are basically identical on average in terms of how much they’ve published.)
As with the data on gender balance of recent ecology faculty hiring, I think the data on gender balance of recent EEB interviews and offers is good news. It represents real, systemic progress with regard to diversity and equity, in one very narrow but nevertheless important bit of EEB. At a systemic level, many faculty search committees in ecology and allied fields now take diversity and equity seriously. They want to hire the best people without being swayed by subconscious or overt biases, or by the legacy of inequities that applicants may have had to overcome in the past. And search committees want to make their departments and institutions more diverse on many dimensions then they have been historically. Diverse departments and institutions can better serve the full range of students they teach and mentor, provide an environment in which everyone can reach their full potential, and can better meet all the complicated challenges that departments and institutions face. To achieve those goals, many search committees these days follow formal procedures designed to ensure fairness and guard against unconscious biases. And importantly, EEB faculty search committees these days typically get to choose among several or even many men and women applicants who are well qualified on paper, and who’d be good fits and would do the job well if hired (as you can tell from the data in this post, and from data on the number of applicants per tenure-track EEB faculty position). So when it comes down to making difficult decisions as to who to interview and who to offer the position to, from among several candidates who would each be excellent in their own unique way, many EEB search committees consider gender as one factor among many others. And they can consider gender as one factor among many others without sacrificing on any other dimension (experience, research productivity, whatever).
Now that I’ve explained how I interpret the gender-related results, here are a bunch of possible misinterpretations of these results, and possible misinterpretations of my own views, that I’d like to address up front in the interests of encouraging a productive conversation here and on social media.
- These results don’t mean that it’s now easy for women to get faculty positions in EEB! That women comprise a majority of recent faculty hires, and report getting slightly more interviews and offers than men on average, does not mean it’s easy for women to get hired! Everybody on the EEB faculty job market faces a very competitive market!
- These results do not show that there’s “reverse discrimination” against men in EEB faculty interviewing or hiring, or that “undeserving” “token” women are getting interviews or offers!
- These are aggregate statistical results that speak to systemic trends. They don’t tell you anything about how any particular search was conducted, or whether any particular applicant was treated fairly.
- These data are about one dimension of applicant diversity, and don’t speak to diversity on any other dimension. Those other dimensions are important too, I just don’t have much or any data on them.
- These data don’t speak to any aspect of gender diversity and equity in EEB outside of the faculty hiring process. They don’t speak to pay equity, or equity in the peer review system, or sexual harassment and sexual assault, or sexist comments, or etc.
- Following on from the previous bullet: I am emphatically not saying or implying that everything is now great for all women in EEB, or that women in EEB should all be happy, or that people should quit caring so much about diversity and equity, or quit working to improve diversity and equity. Because I don’t think any of those things! The gender-related results in this post are one piece of a much larger puzzle; they’re about one important but very narrow aspect of diversity and equity in EEB. Progress on diversity and equity in one area doesn’t somehow make up for lack of progress in some other area (just as lack of progress in one area doesn’t mean there’s been no progress in any area). And I would never tell anyone how to feel, about anything!
- These are systemic data that do not contradict or devalue anyone’s day-to-day lived experience in EEB. Nobody should pit these data against anyone’s lived experience. Conversely, nobody’s lived experience refutes these data. After all, these data are self-reports of people’s lived experiences. I think individual experiences and systemic data are complements, not substitutes. We need both to have productive conversations and to make the world a better place.
- This post is not out to make EEB faculty job seekers happy or sad. Again, I would never tell anyone how to feel about anything! How you feel is a very personal thing. This post provides some information, which hopefully is useful. The more we know, the more effectively we all can work to achieve both our own professional goals and systemic change. (I mean, nobody thinks it would be good to know less about diversity and equity on a systemic level in EEB, right?) But I can imagine that some of you find the information in this post heartening, others find it disheartening, and still others have mixed feelings. All those feelings are valid.
- The fact that I’m writing about these data and not about some other aspect of diversity and equity (or some other topic entirely) just shows what I happen to be inspired to write about, in a way that hopefully adds a bit of value to the world. There are many hugely important topics in ecology, academia, and the world more broadly that I never write about simply because I have nothing to say about them that would be worth reading.
- I am not looking for a cookie by writing this post. Lord knows the world is filled with people who do a lot more than me to improve diversity and equity in academic ecology! Again, my hope is merely to add a bit of value by compiling a bit of data on one narrow topic. Also, writing this post was a good way to procrastinate on some stuff I didn’t feel like doing. 🙂
- I ordered the material in the post as I did because that seemed to give the post a logical flow. If you wish I’d ordered the post differently for whatever reason, well, I’m sorry but I can’t read your mind and write accordingly. Plus, different people would’ve wanted different orderings and I can’t please everyone.
- I don’t like feeling like I need to spell out everything in this bulleted list, because it all seems to me to be so obvious that it should go without saying. Then again, in other contexts there’s clearly a virtue to being explicit. So perhaps we live in a time in which it’s best on balance for everybody to be very explicit about everything. Maybe we should all always err on the side of anticipating and forestalling even the most unlikely potential misunderstandings. I welcome feedback on whether you found this bulleted list helpful, or annoying, or what.
Conclusion: advice for EEB faculty job seekers, and to EEB faculty search committees?
I’m not sure if any good advice for EEB faculty job seekers emerges from these data. Well, besides the obvious and familiar advice to apply for any job for which you’re a possible fit and that you might take if offered.
Ok, one very rough rule of thumb I might suggest, based on these data, is “if you find yourself applying to more than about 30 EEB faculty positions in one year, maybe consider whether you’re throwing your hat into the ring for too many longshots for which you’re a poor fit.” I mean, maybe you aren’t! After all, judging potential “fit” is far from an exact science, so it’s surely best to err on the side of applying if you’re not sure of your “fit”. And if submitting additional longshot applications doesn’t cost you any more time and effort than you want to spend, by all means go ahead. But if you’re sufficiently like a typical applicant in relevant respects, then if you’re submitting more than 30ish applications in a year you might be submitting at least a few that are too poor a fit for you to be worth bothering with. But I dunno, individual circumstances vary so much that I’m not sure that rough rule of thumb is useful at all. Relatedly, see this old post for advice and data on how, and how much, to tailor your application to the hiring institution.
A question on which I’d like to hear comments: do these data change your view on whether EEB faculty searches should be blinded at the initial stage? The most common argument for blinding that I’ve seen is “we all have subtle unconscious biases against women”. But without wanting to deny that’s the case, the data in this post, and in my previous posts on ecology faculty hiring, suggest that the current procedures of EEB faculty search committees are effective at overcoming unconscious bias against women. Indeed, in light of those data I’d be worried that widespread blinding of EEB faculty searches would have a perverse outcome if the goal is to increase hiring of women and members of other historically-underrepresented groups (see here, and here for others with worries along these lines). Thoughts?
Looking forward to your comments, as always. Let’s all live up to our usual high standards around here and keep it professional and respectful. Reasoned disagreement with the post and other commenters is welcome, but trolls are not welcome and will be blocked without warning.

Thank you for thus work and thoughtful reasoned post. As someone who has worked in the HR and equity fields for many years, I find your analysis heartening. For me the message is that, over the long haul, systemic changes have been taking place-the challenge now is to continue to be vigilant, and to ensure that as women, we are mindful of the work still left to do.
Thank you for the feedback Myra, much appreciated.
What is EEB?
Ecology and evolutionary biology
Via Twitter. Always good to see people reading carefully and taking the post in the intended spirit.
More positive feedback:
I’m just going to keep pasting these in here so I can look at them and feel better when someone inevitably tweets something dumb about this post without having read it first. 🙂
Via Twitter:
It’s actually an interesting question, to which I’m unsure of the answer. How many prospective ecology faculty take themselves out of the running for jobs that they would actually like and would do well, in places they would actually like to live? That is, how many people take themselves out of the running because they’re misinformed about the job and/or surrounding area, and/or are misinformed about their own preferences? How many should reflect harder on the old cliche “Don’t knock it ’til you try it?”
My own case provides an example. My wife and I moved overseas for my postdoc, to London. Neither of us had ever lived abroad before, and we weren’t at all sure we wanted to do it. But we took the plunge, and we *loved* it more than I ever imagined we would.
I wouldn’t overgeneralize from my own case. I’m sure many ecology faculty job seekers who think they wouldn’t be happy at a PUI (or in a small town, or far from family, or whatever) are right, they wouldn’t be! But surely *some* non-zero fraction are wrong. The question is, how big is that fraction? I have no idea. I’d guess “not a trivially small fraction”, but that’s a wild guess based on nothing.
Something that I think contributes to making R1 jobs relatively attractive for many job seekers, that I don’t think has been explicitly mentioned, is not just the preference of the job seeker, but also the needs of the family that we bring with us. A lot of PUIs are in small towns that aren’t particularly close to larger metro areas, so job opportunities for partners and access to specialized medical care (which can be especially important for children or aging parents) can be limited. It seems like an R1 at least guarantees a certain minimum level of economic activity, and many have associated med schools. So for those of us trying to balance our careers with the needs of our families, a typical R1 fills some needs that are less often filled by other types of institutions. There are obviously many examples of non-R1 institutions that are in or very near cities, and a lot of great institutions that are in small towns, so this is no knock on them (I have a B.S. from one and loved it), just trying to speak to a reality that I think many job seekers are experiencing.
Yes, I’m sure this is part of it for many people.
No idea how important those sorts of considerations are relative to other factors like “lots of people want to do research and have grad students”. Or even if it makes much sense to speak of “relative importance” here, given that many job seekers probably consider numerous factors in deciding which jobs to apply for. Like, in my own case there were many jobs I didn’t apply for because my research interests didn’t fit them, *and* because they were in places I didn’t want to live, *and* because I didn’t like the mix of teaching and research expectations. Any one of those reasons on its own would’ve been a dealbreaker for me–each was sufficient on its own for me to not apply, but none was necessary. So if you asked me “what was your single most important reason for not applying for job X?”, I’m not sure how I could even answer.
From an ecoevojobs.net comment thread on this post:
“There are so many more problems with the data than the three identified in the article. Perhaps most egregious is that each headline in the post is labeled “The typical EEB faculty job seeker.” That is grievously misleading. The population sampled is “people who wrote on a google doc.” More generously it could be “EEB jobseekers who have written their qualifications on a job board.” If you don’t understand how that population is different from “The typical EEB faculty job seeker,” you shouldn’t be analyzing the data. An immediate red flag to anyone with sampling knowledge is that all observations from all years are pooled so that they are each independent samples. People that report over multiple years shouldn’t be treated as independent observations. That should be obvious to anyone on its face. Basic tenets of statistics aside, I am also bothered by the cavalier attitude of scientists that regurgitate these analyses year after year. While the author can’t control how the information is used, they certainly understand the climate in which these conclusions are shared and perpetuated (ranging from careless thoughts and copied figures on twitter to making sweeping generalizations about gender, race, ethnicity… etc). Frankly, I expect more from both the people doing these analyses and my peers that seem to blindly parrot them year after year. A suggestion would be to instead work with people with expertise in these areas, e.g. social scientists and those with experience in survey analysis and bias estimation.”
In retrospect, I’m not sure why I bothered writing the bit about how, if you don’t think ecoevojobs.net data are worth looking at, you shouldn’t read this post because it will just annoy you. I guess so I could now say “I did warn you.” 🙂
In seriousness, I’d be happy to reply more substantively, but there’s nothing substantive here to reply to. Just the bald assertions that the data are bad and that I don’t know what I’m doing. (Well, except for raising a point I noted myself in the post, while ignoring the fact that I raised it myself: some of the same people report their data more than once, so these observations aren’t all independent of one another.)
p.s. In my admittedly-anecdotal experience, a common symptom of not liking something because it doesn’t agree with your subjective priors, rather than for any substantive reason you can articulate, is to complain about tone or emphasis. The above complaints about the post title and the section titles are examples.
Not that complaints about tone and emphasis aren’t worth discussing. They can be, sometimes. But they’re something on which there’s generally room for a lot of reasonable disagreement. And in my experience, discussions about tone and emphasis generally are most productive when you have them with someone who also engages on substance.
So if your primary objection to this post is that you think it should’ve had a different title and different section headings, thanks for your feedback, but I’m afraid this is something on which there’s room for reasonable disagreement. I don’t see much point in discussing it, so we’ll have to agree to disagree.
p.p.s. The quoted comment has now been deleted, along with several others on the same thread from other people. No idea why or by who, or if it will be restored. Stuff gets both accidentally and purposely deleted on ecoevojobs.net all the time, for all sorts of reasons.
Via ecoevojobs.net:
“Fox attempts to assess how reliable the data are by comparing the % of each population self-reporting in the Anon Quals here with other more robust estimates of % of each population reported elsewhere. The things that’s missing is an interaction between gender and probability of self-reporting. For example, if men were more likely to self-report anon quals when they’re not successful, and women were more likely to self-report anon quals when they are successful, that could produce the observed results (including the cross-walk under “EEB faculty job seekers as a group”). There is lots of good research demonstrating that such an interaction between confidence/gender exists, and that interaction is a primary limitation of the analysis. Yes, there’s more robust evidence available that more women are being hired to EEB positions recently (and that’s, to me, good news); I’m not sure this analysis adds anything to that fact.”
To which, yes, that’s exactly the *kind* of gender-specific reporting bias it would take for the gender-related results in the post to be artifactual. I very much appreciate readers thinking through the data like this, rather than just saying (in so many words) “these data are terrible, any idiot knows that”.
I guess my question is, is there any reason to think that particular reporting bias exists? There’s no link to the claimed “good research” showing this, so I dunno. Is there really a lot of research showing that women tend to respond to anonymous surveys more than men when they’re reporting good news and/or positive information about themselves? Whereas men are more likely than women to respond to anonymous surveys when the information being reported is bad news or negative information about the respondent? Just offhand, that sounds…off to me. Is the argument here “women aren’t confident enough to report bad news about themselves, whereas men are”? I mean, maybe? But I dunno, why not “men brag more than women, even on anonymous surveys, so are more likely to report good news about themselves, whereas women tend to talk themselves down”? That would be a reporting bias in the *opposite* direction of the results reported in the post, but it sounds at least as plausible to me as the reporting bias hypothesized by the ecoevojobs.net commenter.
So I dunno. It’s not clear to me how statistical differences in average personality between men and women would translate into a gender-specific reporting bias on ecoevojobs.net.
And now the quoted comment (and others) have been deleted. Again, no idea why.
The updated post now includes some analyses addressing the possibility of gender-associated reporting bias.
Jeremy, great post. I enjoyed reading it. I appreciate your clarity and thoughtful explanations. It was very well articulated, interesting, and also useful as someone interesting in the EEB job field. In my experience, the gender issue of EEB hires etc. can easily become an emotionally-fueled discussion. These data/analyses shed light on the recent trends. Thanks for taking the time. For me the take home is: Wow, it is hard for most everyone to land a job, and people likely apply to more than you would think. I will start the mental preparation for that hurdle. Thanks again. Now back to whatever you were procrastinating on, eh? Best, Aaron
Thanks for the kind words Aaron, glad you found the post interesting and useful.
Via Twitter:
I’m going to make a few comments not related to the main thrust of the post. (Uh oh)
1. Wow. Jeremy, you must have really been raked over the coals in past posts based on the comment by gender preamble (that occurs in every post where gender is a topic) and the bullet list. Do you have a cheat sheet on the side so you can copy/paste the caveats? I guess that goes with the decision to blog. But did the coal-raking get worse with the inclusion of Twitter? Even though you don’t want a cookie, I would like to say how much I appreciate these posts, especially since I’ve begun the transition to administrator and it helps me understand what the applicant pool is facing broadly.
2. Looks like 6 people submitted >50 applications (one with 100) and got no offers, though everyone (that reported) at least got one on-campus interview (maybe only 3 did based on update). Ouch. I hope those folks have very supportive friends and family, because that’s a tough return.
Re: 1: oh, I wouldn’t say I’ve been raked over the coals. As I said in the post, the vast majority of responses to my past posts on gender and equity in the ecology faculty job market have been positive (perhaps in part because I’ve anticipated and addressed questions and misunderstandings up front). It’s just that the rare unproductive responses are *super* annoying to me. If I put a lot of time and effort into a post, it really bugs me if even one person misreads it, or makes unwarranted inferences from it. It’s especially annoying when the same individual makes the same misreading or mistaken inference multiple times, and persists in doing so after being corrected; that’s happened once or twice.
I’m willing to invest a lot of time and effort into reducing the annoyance level in my life to zero. Which is why I wrote the post as I did.
Whether my extreme annoyance at very rare unproductive comments makes me a sensitive snowflake, or someone with a rich appreciation of how rare unproductive comments can derail an online conversation among strangers about a sensitive topic, I leave to others to judge. 🙂 Those two possibilities aren’t mutually exclusive or exhaustive, of course. 🙂
The other reason I wrote that long bulleted list (and also wrote a long careful methods section and a cautiously-worded results section) is to build/maintain a good reputation with the large majority of people, who don’t need any prompting from me to read carefully and comment thoughtfully. I figure having a good reputation with those folks will encourage them to return and read other posts. And having a good reputation with a lot of people will hopefully serve me in good stead if I ever do write something that’s poorly phrased or otherwise bad, and I need readers to forgive me or give me the benefit of the doubt.
Yes, I would say that Twitter has made things worse on this front for us, though even on Twitter the large majority of comments about our posts are positive. That’s why I’ve mostly stopped looking at ecology Twitter, and completely stopped tweeting myself. The rare annoying tweets about our posts bug me too much; seeing them is bad for my mental health. But your mileage may vary, of course. Some people love ecology Twitter as a discussion forum, and that’s fine. Different strokes for different folks.
If I were writing a blog, I’d very likely use the same approach for the same reasons. It’s funny how an unproductive response by email/social media grates on me so much more than the same comment would in person.
I like Twitter to find info–like “Check out this new pub.” Otherwise, I don’t engage much (or other social media). I doubt you’ll see any comments about DE from me on Twitter. Only here. Most of the time I don’t even see/can’t find the tweets you repost here. Probably I should reread Meghan’s How-to-use-Twitter post again. 🙂
And yes, I did copy and paste some of the discussion of the gender-related results from my old posts on gender balance of recent ecology faculty hires. Although it would’ve been fast to rewrite it all from scratch. The ways in which people are likely to misunderstand or object to these results are pretty predictable (understandably so in some cases, depressingly so in others). And so the answers to their misunderstandings and objections are easy and quick for me to provide even if I’m not copying and pasting.
2018-19 job season isn’t quite complete, but FWIW here’s a quick summary of the ecoevojobs.net anon quals data so far. tl;dr: looks very similar to recent years.
102 people provided their anon quals. 53 women, 49 men. Very little missing data.
All but one applicant who provided race/ethnicity identifies as white.
Applicants report submitting anywhere from 1-90 applications this year. Women report submitting an average of 17.5 applications this year, vs. 23.1 for men.
Women and men are equally experienced on average. Mean PhD years are 2015.6 for women and 2015.3 for men.
Women report an average of 12.4 publications, of which 6.6 are first-authored, vs. 17.8 and 8.7 for men.
Women report having taught 2.7 classes on average, vs. 2.9 for men (omitting one outlier, an experienced male associate prof who’s taught 250 classes).
Women report receiving 2.8 phone/skype interviews this year on average, vs. 2.6 for men.
Women report receiving an average of 2.1 campus interviews this year, vs. 1.5 for men.
Women report receiving 0.7 offers this year on average, vs. 0.5 for men. 49% of women report receiving at least one offer, counting a nonreport as a zero. 35% of men report receiving at least one offer, counting 3 nonreports as zeroes.
Among recipients of multiple offers, women outnumber men 9 to 5.
Pingback: What fraction of ecology PhD recipients go on to TT faculty positions? | Dynamic Ecology
Pingback: EEB seminar series are almost gender balanced | Dynamic Ecology
Pingback: Gender balance of the faculty and chairs of N. American EEB departments | Dynamic Ecology
Pingback: Are there any measurable predictors of how many interviews or offers an ecology faculty job seeker will receive in the US or Canada? | Dynamic Ecology